How to use Amazon Brand Analytics


Selling on Amazon means having access to a multitude of data. Some are directly related to the results of your products on the Marketplace, others are related to your product category and consumer behavior: these are the ones we're going to talk about today. Whether you are in Vendor or Seller configuration on the platform, you have permanent access to statistics to understand what the typical profile of your consumer is and how best to reach them.
"Such an analysis tool is necessarily very expensive" you'd think. Well, it isn't! The tool made available on Amazon is called Brand Analytics, it's free, available to any seller and brand new. The information provided by Brand Analytics is rich, very rich and will allow you to better understand what consumers are looking for. You will thus be able to adapt your strategy and increase your sales tenfold: we explain!

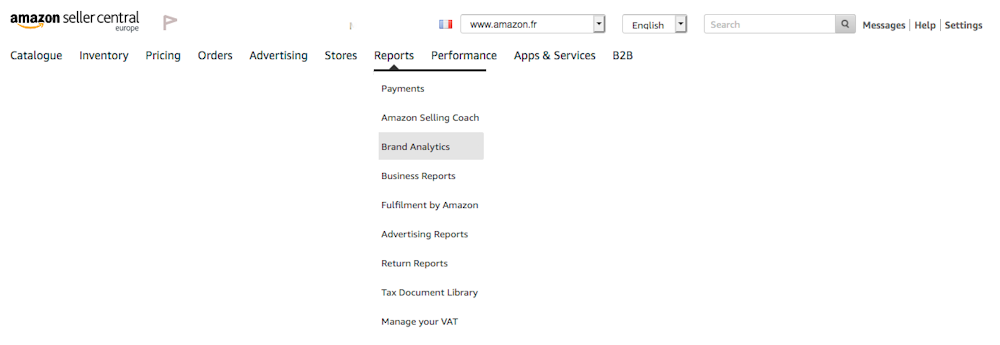
You can easily find the tool in your Seller interface.
Moving from Retail Analytics to Brand Analytics, Amazon gives data to everyone
Amazon Brand Analytics is a porting and opening of a much older tool: Retail Analytics. Previously, statistics were reserved for Vendor Central and consequently for salespeople invited by Amazon to join the program. They were then able to generate complete reports about sales and traffic.
The arrival of Brand Analytics is a "game changer": all the salespeople in the Marketplace have access to statistics to help them in their decision making. Eligibility criteria for Amazon Brand Analytics are as follows:
You must be an active seller on Amazon
Your trademark must be registered with Amazon through the Brand Registry program.
You are the owner or representative of the trademark
In other words: any brand owner can use data to maximize sales on Amazon and you would be wrong to deprive yourself of it!
Understanding and using Brand Analytics tools
Accessible in the Vendor and Seller Central interfaces, Amazon Brand Registry gives you a dashboard for analyzing consumer behavior. The dashboard is divided into three key features, each of which allows you to get to know your customers better and adapt your strategy on Amazon.
1. Search terms
The first module of ABA shows you in a few clicks how your products and those of your competitors are positioned in relation to a specific search. Amazon does not provide figures for the search volumes of keywords, but ranks according to the combination of words you enter. In fact, the tool looks like this:

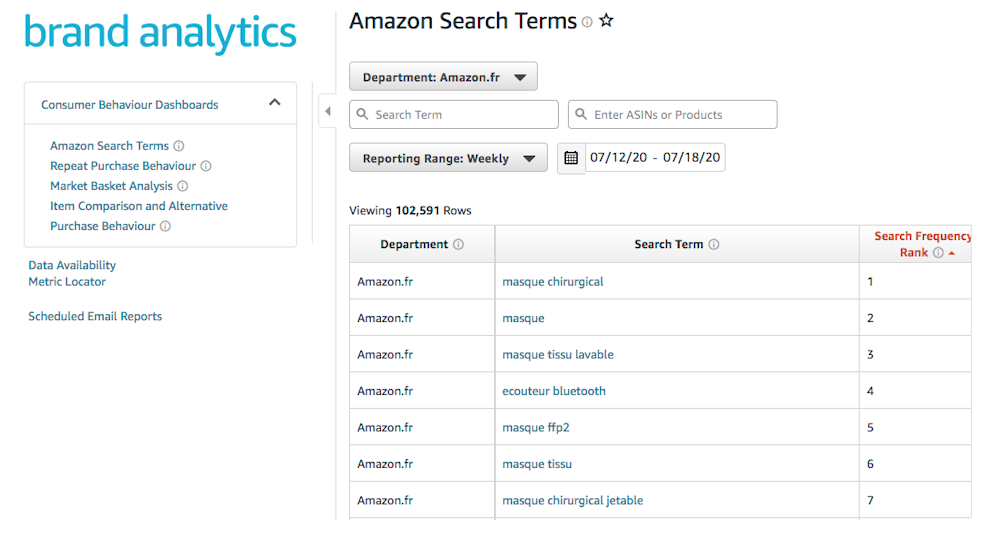
The Search Terms interface
Key KPIs:
The most searched keywords on Amazon over a given period of time.
Search Frequency Rank: The ranking of a combination of keywords based on their popularity as calculated by Amazon. Amazon, however, only gives the ranking of words in relation to each other and not the search volumes.
Click share is the percentage of clicks received by the product relative to the total number of clicks after a search. Are your competitors more clicked than you are?
Conversion share is the ratio of conversions of your referral to all conversions of the search. In other words, how well does your product sell compared to others on this keyword combination?
Tips
by Bizon
By knowing the most popular searches of the moment and the referrals that perform best on them, you can optimize the targeting of your advertising campaigns and your SEO goals.
2. Market Basket analysis
Which products do your customers most frequently buy together? To answer this question, this section compares your references.

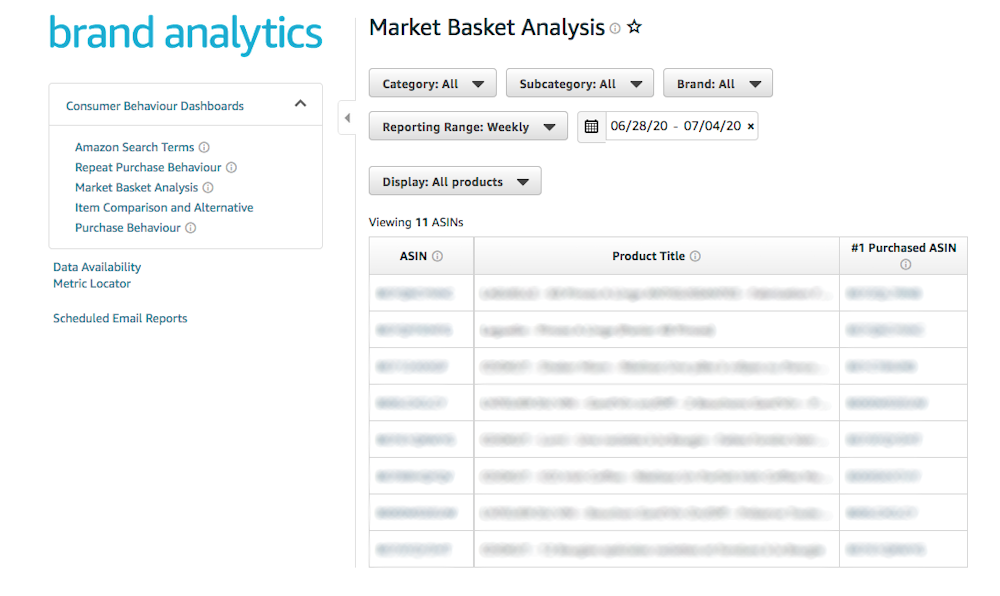
The Market Basket Analysis interface
Key KPI: the N°1 of the combinations in % corresponds to the following ratio ➡️ orders containing your product and your product n°1/total number of orders which contained at least 2 items including your product
In non-Amazonian language: we observe which items are the most purchased to complement your best sellers.
Tips
by Bizon
This type of information can be crucial for you to adapt your product strategy. If the product most frequently purchased with yours is that of a competitor, you need to adapt your catalogue. You can propose a similar product or highlight a product that already exists in your catalog but does not perform well.
This can for example be an opportunity to create bundles of products sold together: if your pie dish is often bought with a spatula, why not create a variation offering both products together with a discount?
📝 Note: in order for the data in this report to be interesting, a certain number of clicks and traffic must be recorded on the products. Otherwise they will be automatically associated by Amazon with other irrelevant references.
3. The "Item Comparison and Alternative Purchase Behaviour" report
In the same way as the previous report, this one allows you to analyze which products are most consulted with yours.

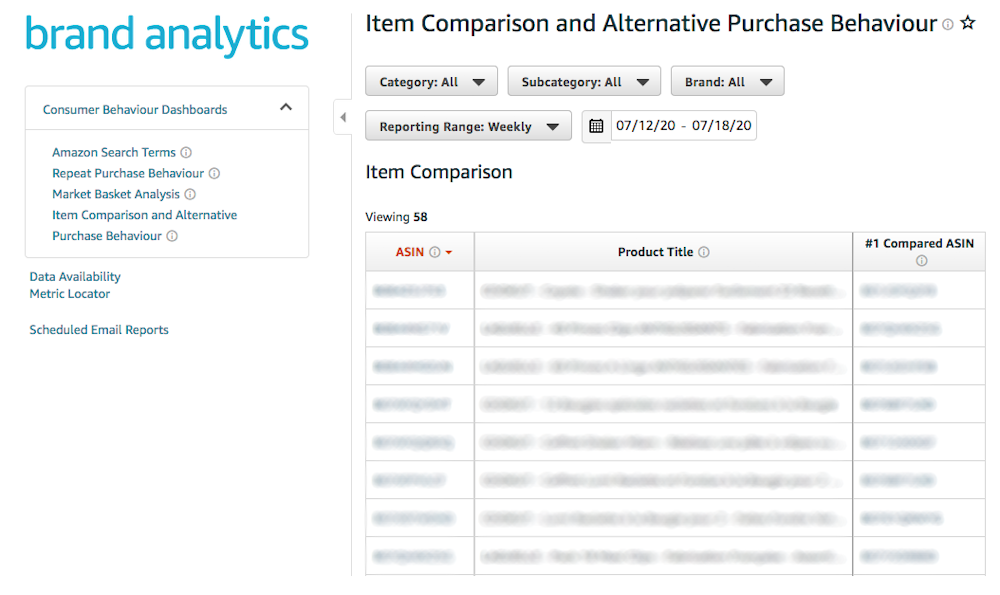
The Item Comparison and Alternative Purchase Behaviour interface
Key KPI: the compared percentage allows you to see how many of your visitors have also seen the product with which it is compared. The % compared n°1 is the product with which your reference is the most seen.
Tips
by Bizon
This KPI is useful in two ways: it allows you to observe which products could be complementary with yours and to identify with which competing references your customer hesitates.
📝 Note: As with the previous point, the more traffic Amazon gets, the more relevant the report will be.


COO


